Line Graph
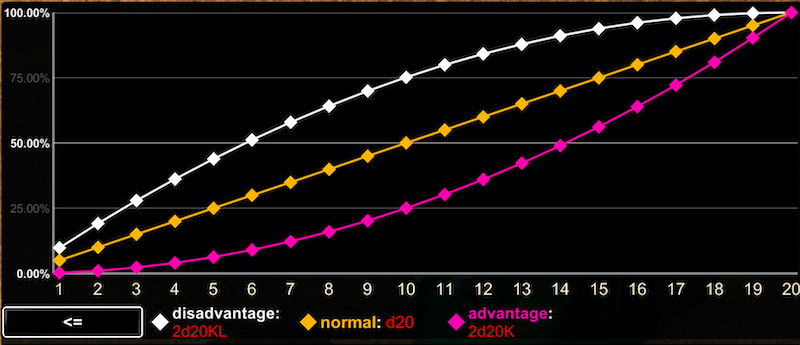
The line graph provides a summary of all results of the tested expression. (See here to learn how to write expressions with multiple results for comparison). The vertical axis of the graph is the percentage of all sampled outcomes for each result (this is equivalent to the result's probabilities, with enough sampling).
The horizontal axis of the graph lists the recorded outcomes.
Each result is color-coded (the colors are enumerated beneath the graph)
The line graph has three ways to display the sampled outcomes:
- = - Shows the percentage of a result's samples that equal each outcome.
- <= - Shows the percentage of a result's samples that are below or equal to each outcome.
- >= - Shows the percentage of a result's samples that are above or equal to each outcome.
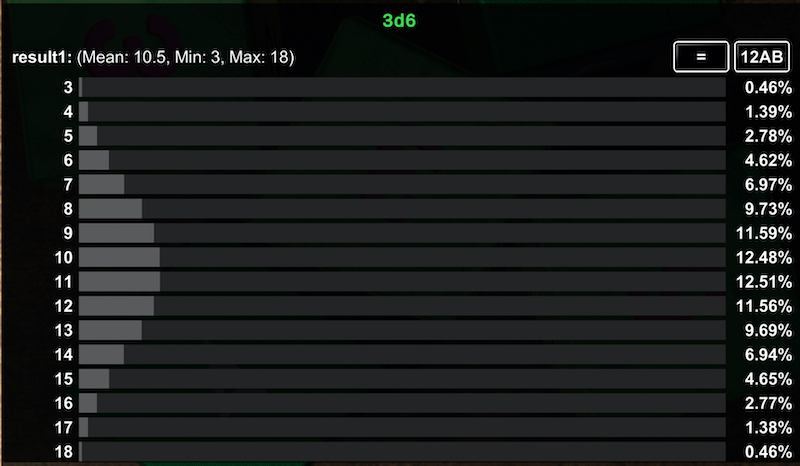
 The chart can be viewed using the same options as the line graph (=, <=, and >=), and ordered either by outcome frequency or alhanumerically.